Market Outlook
March 03, 2017
Market Cues
Domestic Indices
Chg (%)
(Pts)
(Close)
Indian markets are likely to open negative tracking the SGX Nifty and global cues.
BSE Sensex
(0.5)
(145)
28,840
US stocks lost ground on Thursday as stocks reacted to the strong possibility of a
Nifty
(0.5)
(46)
8,900
hike in interest rates over the near term. The Labor Department released a report
Mid Cap
(1.4)
(192)
13,378
showing that initial jobless claims fell to their lowest level in over forty years to
Small Cap
(1.3)
(178)
13,574
223,000 against expectations of an increase up to 245,000. The NYSE Arca Steel
Index plunged by 4.1 percent giving up its gains from yesterday. Weakness in gold
Bankex
(1.1)
(269)
23,437
stocks also led to the NYSE Arca Gold Bugs Index closing down by 4.4 percent.
UK stocks had a flat session on mixed earnings results. Building materials supplier
Global Indices
Chg (%)
(Pts)
(Close)
Travis Perkins fell over 6 percent after it reported a 67 percent drop in pretax profit
Dow Jones
(0.5)
(113)
21,003
because of restructuring costs. Military and civil systems provider Cobham gained
Nasdaq
(0.7)
(43)
5,861
13 percent on news that it would raise 500 mln pounds via a rights issue.
FTSE
(0.0)
(1)
7,382
Indian indices opened positive but reversed all gains to close firmly in negative
Nikkei
0.9
171
19,565
territory. All sectoral indices closed negative except for the Auto index which closed
Hang Seng
(0.2)
(48)
23,728
up 0.36 percent as the impact of demonetization was less than feared. The biggest
Shanghai Com
(0.5)
(17)
3,230
loser for the session was the PSU banking index, which closed down 1.92 percent on
profit booking after the recent rally.
Advances / Declines
BSE
NSE
News Analysis
Advances
919
396
Glenmark ties up with Evestra to develop contraceptive drug
Declines
1,993
1,266
DLF stock drops on promoters plan to sell 40% stake in rental arm
Unchanged
151
69
Detailed analysis on Pg2
Volumes (` Cr)
Investor’s Ready Reckoner
BSE
3,497
Key Domestic & Global Indicators
NSE
24,761
Stock Watch: Latest investment recommendations on 150+ stocks
Refer Pg5 onwards
Net Inflows (` Cr)
Net
Mtd
Ytd
Top Picks
FII
(97)
(97)
10,341
CMP
Target
Upside
Company
Sector
Rating
MFs
1,000
1,855
7,070
(`)
(`)
(%)
Amara Raja Batteries Auto & Auto Ancillary
Buy
844
1,009
19.5
Top Gainers
Price (`)
Chg (%)
HCL Tech
IT
Buy
842
1,000
18.7
Power Grid Corp.
Power
Buy
190
223
17.5
Nationalum
75
5.2
Navkar Corp.
Others
Buy
164
265
62.1
Aplltd
597
4.1
KEI Industries
Others
Buy
173
207
19.4
Jublfood
1,036
3.2
More Top Picks on Pg3
Tatamotors
461
2.7
Balkrisind
1,342
2.5
Key Upcoming Events
Previous
Consensus
Date
Region
Event Description
Reading
Expectations
Top Losers
Price (`)
Chg (%)
Mar 03 Germany PMI Services
54.4
54.4
Dlf
141
(8.1)
Mar 07 China
Exports YoY%
7.90
13.00
Mar 08 Euro Zone Euro-Zone GDP s.a. (QoQ)
0.40
--
Biocon
1,034
(7.3)
Mar 09 China
Consumer Price Index (YoY)
2.50
1.70
Jpassociat
15
(6.6)
Mar 09 India
Exports YoY%
4.3
--
Ibrealest*
79
(6.2)
More Events on Pg4
Network18
37
(5.8)
As on March 02, 2017
Market Outlook
March 03, 2017
News Analysis
Glenmark ties up with Evestra to develop contraceptive drug
Glenmark Pharmaceuticals has tied up with Evestra to develop and market a
generic version of Merck's female contraceptive product. The companies will file
for product approval in FY19.
Under the agreement, Evestra will develop generic version of NuvaRing exclusively
for Glenmark for the US market. As part of the agreement Evestra will receive
milestone payments during various stages of the drug’s development as well as
royalties on net sales.
The partnership with Evestra is an attempt to create a drug that becomes a leading
non-daily contraceptive option prescribed for millions of women in the US.
DLF stock drops on promoters plan to sell 40% stake in rental
arm
DLF's share price fell by over 8 per cent following news that its promoters will enter
into an agreement with Singapore's GIC to sell 40 per cent of their stake in
company's rental arm, DCCDL, for an estimated `13,000cr.
Global investors Blackstone and GIC were in the race to acquire the 40 per cent
stake of DLF promoters in DCCDL.
The country's largest real estate developer, DLF, had announced in October 2015
that its promoters would sell their entire stake in DLF Cyber City Developers
(DCCDL), which holds the bulk of the commercial assets of the group.
Economic and Political News
GST Council proposed raising peak tax rate to 20 per cent, from 14 per cent
Indian Navy successfully tests anti-ship missile launched form indigenously
built Kalvari class submarines
Nasscom sees IT industry FY18 growth at 8-10%
Tax incentives to encourage real estate developers to enter affordable housing
segment: ICRA
Corporate News
Nalco posts highest ever bauxite production from period of April 2016 to
February 2017
Crompton Greaves changes name to CG Power and Industrial Solutions
Hindalco Industries sets floor price of `184.45 for qualified institutional
placement of shares for an issue size of `3,300cr
Market Outlook
March 03, 2017
Top Picks
Large Cap
Market Cap
CMP
Target
Upside
Company
Rationale
(` Cr)
(`)
(`)
(%)
To outpace battery industry growth due to better
Amara Raja Batteries
14,423
844
1,009
19.5
technological products leading to market share gains in both
the automotive OEM and replacement segments.
The stock is trading at attractive valuations and is factoring
HCL Tech
1,18,886
842
1,000
18.7
all the bad news.
Back on the growth trend, expect a long term growth of 14%
Infosys
2,34,438
1,021
1,249
22.3
to be a US$20bn in FY2020.
Strong order backlog and improvement in execution would
Larsen & Toubro
1,37,612
1,475
1,634
10.8
trigger the growth for the L&T
One of the largest pharma companies with strong
Lupin
65,969
1,461
1,809
23.8
international presence. It has a rich pipeline of ANDAs which
is also one of the largest among the generic companies.
Going forward, we expect the company to report strong
Power Grid Corporation
99,269
190
223
17.5
top-line CAGR of ~16% and bottom-line CAGR of ~19%
over FY16-18 on back of strong capitalization guidance
Source: Company, Angel Research
Mid Cap
Market Cap
CMP
Target
Upside
Company
Rationale
(` Cr)
(`)
(`)
(%)
We expect the company would report strong profitability
Asian Granito
838
279
351
26.0
owing to better product mix, higher B2C sales and
amalgamation synergy.
Among the top 4 players in the consumer durables segment.
Bajaj Electricals
2,599
257
295
14.9
Improved profitability backed by turn around in E&P segment.
Strong order book lends earnings visibility.
Favourable outlook for the AC industry to augur well for
Cooling products business which is out pacing the market
Blue Star
5,410
566
634
12.0
growth. EMPPAC division's profitability to improve once
operating environment turns around.
With a focus on the low and medium income (LMI) consumer
Dewan Housing Finance
10,162
325
350
7.8
segment, the company has increased its presence in tier-II &
III cities where the growth opportunity is immense.
Strong loan growth backed by diversified loan portfolio and
Equitas Holdings
5,861
174
235
35.3
adequate CAR. ROE & ROA likely to remain decent as risk of
dilution remains low. Attractive valuations considering growth.
Economic recovery to have favourable impact on advertising
& circulation revenue growth. Further, the acquisition of a
Jagran Prakashan
6,166
189
225
19.3
radio business (Radio City) would also boost the company's
revenue growth.
High order book execution in EPC segment, rising B2C sales
KEI Industries
1,348
173
207
19.4
and higher exports to boost the revenues and profitability
Speedier execution and speedier sales, strong revenue visibilty
Mahindra Lifespace
1,420
346
522
50.9
in short-to-long run, attractive valuations
Higher growth in domestic branded sales and healthy export
Mirza International
1,083
90
107
18.9
to boost the profitability.
Massive capacity expansion along with rail advantage at ICD
Navkar Corporation
2,332
164
265
62.1
as well CFS augurs well for the company
Market leadership in Hindi news genre and no. 2 viewership
ranking in English news genre, exit from the radio business,
TV Today Network
1,552
260
385
48.0
and anticipated growth in ad spends by corporates to benefit
the stock.
Source: Company, Angel Research
Market Outlook
March 03, 2017
Key Upcoming Events
Global economic events release calendar
Bloomberg Data
Date
Time
Country
Event Description
Unit
Period
Last Reported
Estimated
Mar 03, 2017
2:25 PM Germany PMI Services
Value
Feb F
54.40
54.40
Mar 07, 2017
China
Exports YoY%
% Change
Feb
7.90
13.00
Mar 08, 2017
3:30 PM Euro Zone Euro-Zone GDP s.a. (QoQ)
% Change
4Q F
0.40
Mar 09, 2017
7:00 AM China
Consumer Price Index (YoY)
% Change
Feb
2.50
1.70
India
Exports YoY%
% Change
Feb
4.30
Mar 10, 2017
6:15 PM Euro Zone ECB announces interest rates
%
Mar 9
0.00
India
Imports YoY%
% Change
Feb
10.70
3:00 PM UK
Industrial Production (YoY)
% Change
Jan
4.30
5:30 PM India
Industrial Production YoY
% Change
Jan
-0.40
7:00 PM US
Change in Nonfarm payrolls
Thousands
Feb
227.00
174.00
7:00 PM US
Unnemployment rate
%
Feb
4.80
4.70
Mar 14, 2017 12:00 PM India
Monthly Wholesale Prices YoY%
% Change
Feb
5.25
US
Producer Price Index (mom)
% Change
Feb
1.10
Mar 15, 2017
3:00 PM UK
Jobless claims change
% Change
Feb
-42.40
6:00 PM US
Consumer price index (mom)
% Change
Feb
0.60
0.00
11:30 PM US
FOMC rate decision
%
Mar 15
0.75
0.75
March 16, 2017 6:00 PM US
Housing Starts
Thousands
Feb
1246.00
1250.00
3:30 PM Euro Zone Euro-Zone CPI (YoY)
%
Feb F
2.00
6:00 PM US
Building permits
Thousands
Feb
1293.00
1250.00
5:30 PM UK
BOE Announces rates
% Ratio
Mar 16
0.25
Mar 17, 2017
6:45 PM US
Industrial Production
%
Feb
(0.25)
0.20
Mar 21, 2017
3:00 PM UK
CPI (YoY)
% Change
Feb
1.80
Mar 22, 2017
7:30 PM US
Existing home sales
Million
Feb
5.69
Mar 23, 2017
8:30 PM Euro Zone Euro-Zone Consumer Confidence
Value
Mar A
(6.20)
7:30 PM US
New home sales
Thousands
Feb
555.00
Source: Bloomberg, Angel Research
Market Outlook
March 03, 2017
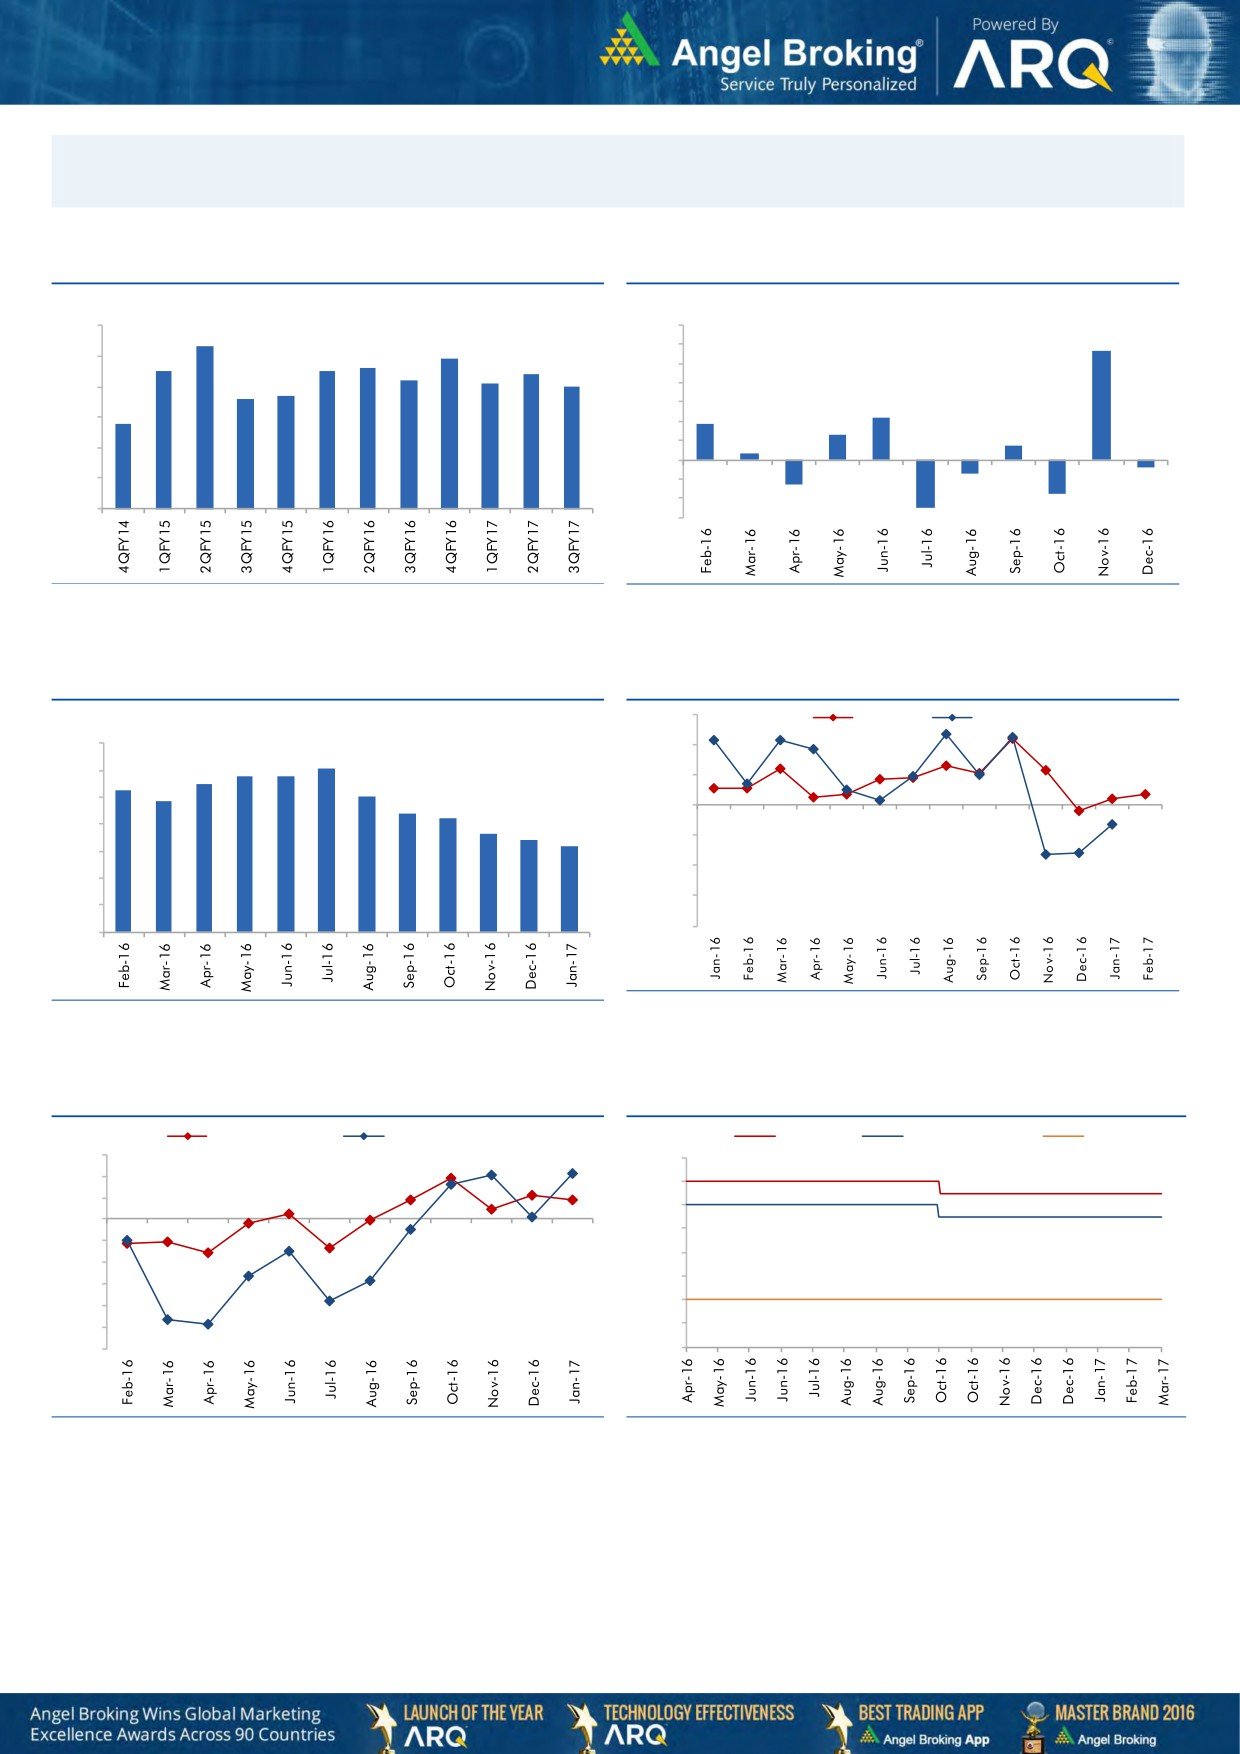
Macro watch
Exhibit 1: Quarterly GDP trends
Exhibit 2: IIP trends
(%)
(%)
9.0
8.3
7.0
5.7
7.9
6.0
8.0
7.5
7.5
7.6
7.4
7.2
5.0
7.1
7.0
6.6
6.7
4.0
7.0
3.0
2.2
5.8
1.9
6.0
2.0
1.3
0.7
1.0
0.3
5.0
-
4.0
(1.0)
(0.7)
(0.4)
(2.0)
3.0
(1.3)
(3.0)
(1.8)
(2.5)
Source: CSO, Angel Research
Source: MOSPI, Angel Research
Exhibit 3: Monthly CPI inflation trends
Exhibit 4: Manufacturing and services PMI
56.0
Mfg. PMI
Services PMI
(%)
7.0
54.0
6.1
5.8
5.8
6.0
5.3
5.5
5.1
52.0
4.8
5.0
4.4
4.2
50.0
3.6
4.0
3.4
3.2
48.0
3.0
46.0
2.0
44.0
1.0
42.0
-
Source: Market, Angel Research; Note: Level above 50 indicates expansion
Source: MOSPI, Angel Research
Exhibit 5: Exports and imports growth trends
Exhibit 6: Key policy rates
(%)
Exports yoy growth
Imports yoy growth
(%)
Repo rate
Reverse Repo rate
CRR
15.0
7.00
10.0
6.50
5.0
6.00
0.0
5.50
(5.0)
5.00
(10.0)
4.50
(15.0)
4.00
(20.0)
(25.0)
3.50
(30.0)
3.00
Source: Bloomberg, Angel Research
Source: RBI, Angel Research
Market Outlook
March 03, 2017
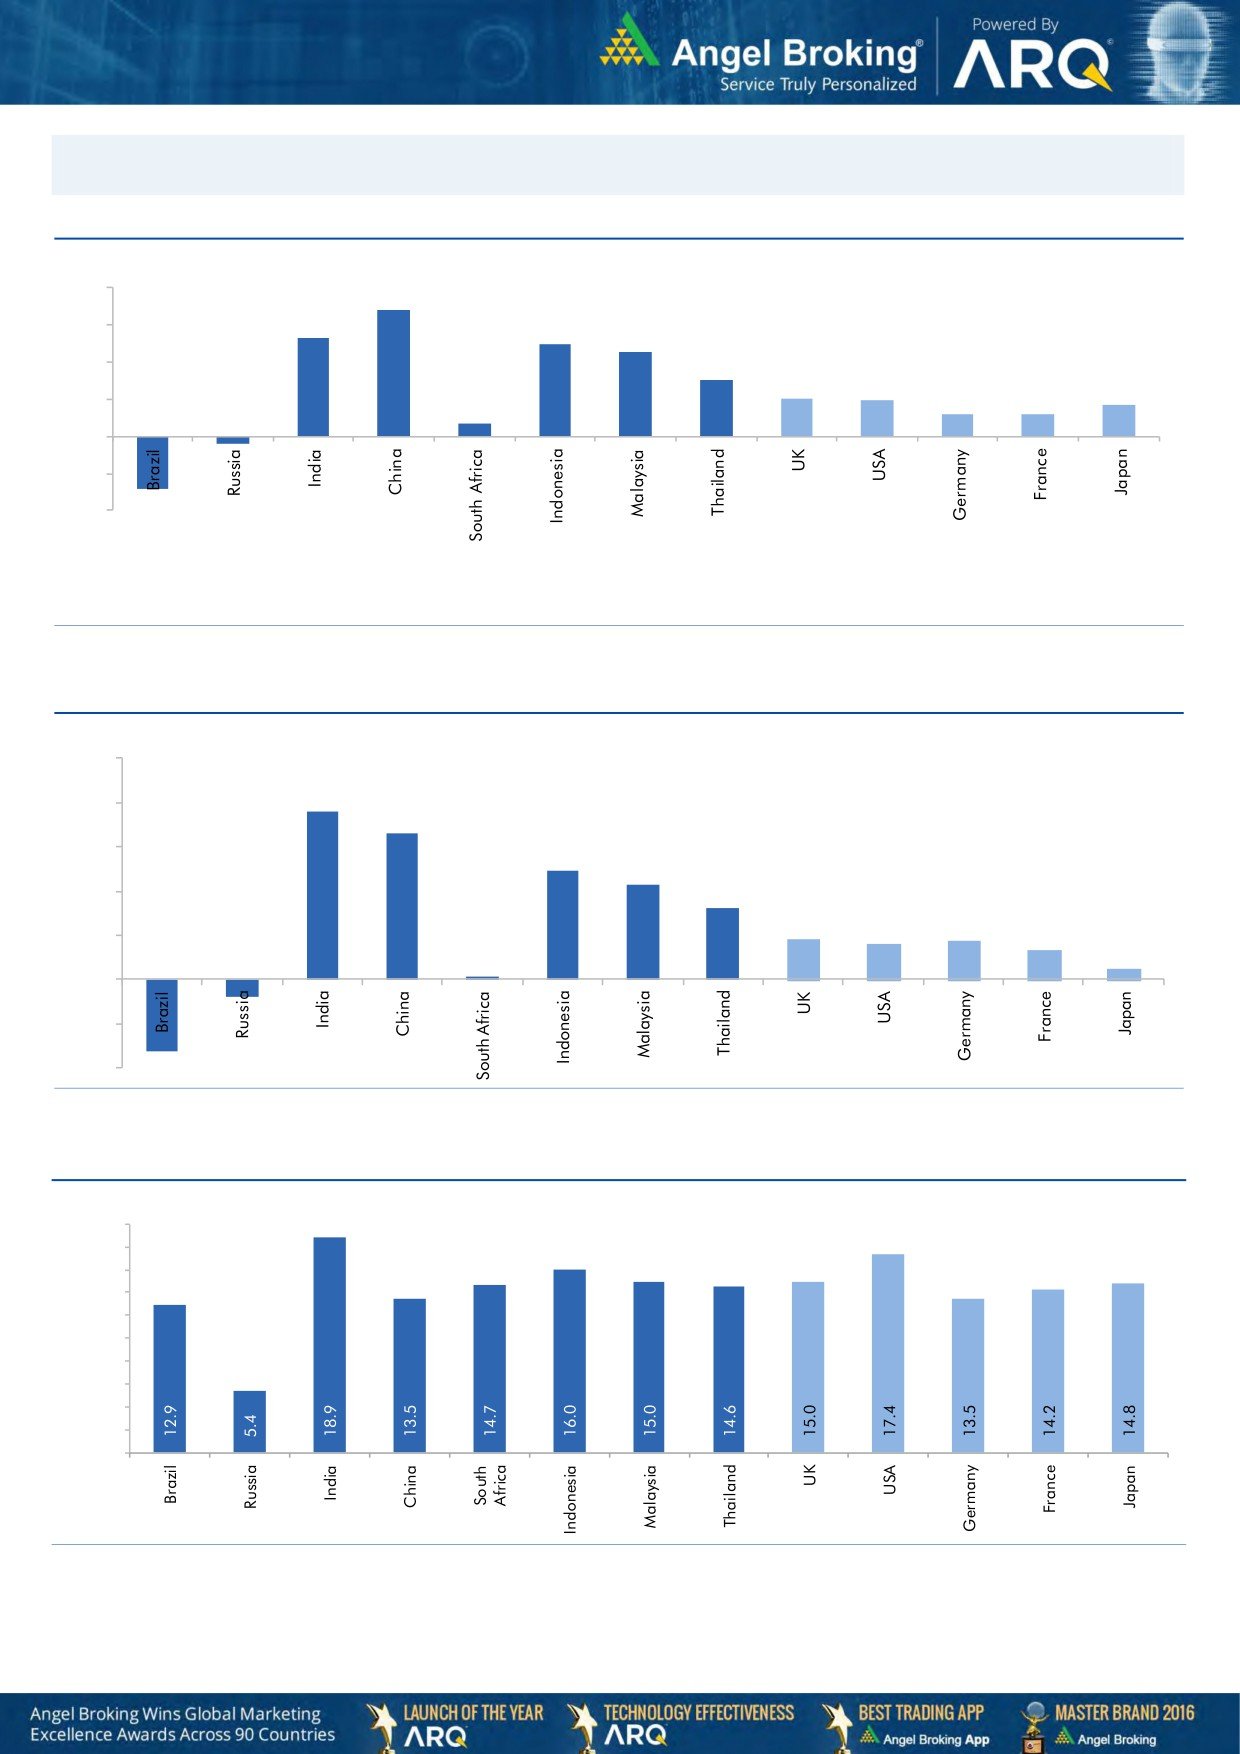
Global watch
Exhibit 1: Latest quarterly GDP Growth (%, yoy) across select developing and developed countries
(%)
8.0
6.8
0.7
5.3
6.0
4.9
4.5
4.0
3.0
2.0
1.9
1.2
1.2
1.7
2.0
-
(2.0)
(0.4)
(4.0)
(2.9)
Source: Bloomberg, Angel Research
Exhibit 2: 2016 GDP Growth projection by IMF (%, yoy) across select developing and developed countries
(%)
10.0
7.6
8.0
6.6
6.0
4.9
4.3
4.0
3.2
1.8
1.7
1.6
2.0
1.3
(0.8)
0.5
(3.3)
0.1
-
(2.0)
(4.0)
Source: IMF, Angel Research
Exhibit 3: One year forward P-E ratio across select developing and developed countries
(x)
20.0
18.0
16.0
14.0
12.0
10.0
8.0
6.0
4.0
2.0
-
Source: IMF, Angel Research
Market Outlook
March 03, 2017
Exhibit 4: Relative performance of indices across globe
Returns (%)
Country
Name of index
Closing price
1M
3M
1YR
Brazil
Bovespa
65,855
(0.3)
4.8
49.3
Russia
Micex
2,049
(8.3)
(2.7)
9.1
India
Nifty
8,900
3.1
8.2
26.8
China
Shanghai Composite
3,230
1.9
(1.6)
10.6
South Africa
Top 40
44,837
(2.4)
2.8
2.4
Mexico
Mexbol
47,289
0.4
4.4
5.4
Indonesia
LQ45
898
2.2
4.7
10.5
Malaysia
KLCI
1,716
1.4
5.6
3.5
Thailand
SET 50
986
(0.9)
5.4
19.9
USA
Dow Jones
21,003
5.2
10.0
24.0
UK
FTSE
7,382
4.0
9.0
19.1
Japan
Nikkei
19,565
2.7
6.6
21.9
Germany
DAX
12,060
4.5
14.5
24.0
France
CAC
4,964
4.5
8.8
10.5
Source: Bloomberg, Angel Research
Stock Watch
March 03, 2017
Company Name
Reco
CMP
Target
Mkt Cap
Sales ( Čcr )
OPM(%)
EPS (Č)
PER(x)
P/BV(x)
RoE(%)
EV/Sales(x)
(Č)
Price ( Č)
( Č cr )
FY17E FY18E
FY17E
FY18E
FY17E
FY18E
FY17E
FY18E
FY17E
FY18E
FY17E
FY18E
FY17E
FY18E
Agri / Agri Chemical
Rallis
Neutral
234
-
4,559
1,937
2,164
13.3
14.3
9.0
11.0
26.1
21.3
4.5
4.0
18.4
19.8
2.4
2.1
United Phosphorus
Neutral
701
-
35,560
15,176
17,604
18.5
18.5
37.4
44.6
18.8
15.7
3.7
3.0
21.4
21.2
2.5
2.1
Auto & Auto Ancillary
Ashok Leyland
Buy
87
111
24,873
20,021
21,915
11.6
11.9
4.5
5.3
19.4
16.4
4.0
3.5
20.6
21.5
1.2
1.1
Bajaj Auto
Neutral
2,832
-
81,943
25,093
27,891
19.5
19.2
143.9
162.5
19.7
17.4
5.5
4.7
30.3
29.4
3.0
2.6
Bharat Forge
Neutral
1,042
-
24,246
7,726
8,713
20.5
21.2
35.3
42.7
29.5
24.4
5.5
4.9
18.9
20.1
3.2
2.8
Eicher Motors
Neutral
23,449
-
63,805
16,583
20,447
17.5
18.0
598.0
745.2
39.2
31.5
13.4
10.2
41.2
38.3
3.7
2.9
Gabriel India
Accumulate
115
130
1,645
1,544
1,715
9.0
9.3
5.4
6.3
21.2
18.2
4.0
3.5
18.9
19.5
1.0
0.9
Hero Motocorp
Accumulate
3,228
3,446
64,453
28,083
30,096
15.3
15.7
171.8
187.0
18.8
17.3
6.6
5.5
30.1
27.9
2.1
1.9
Jamna Auto Industries Neutral
207
-
1,645
1,486
1,620
9.8
9.9
15.0
17.2
13.8
12.0
3.0
2.6
21.8
21.3
1.2
1.1
L G Balakrishnan & Bros Neutral
555
-
871
1,302
1,432
11.6
11.9
43.7
53.0
12.7
10.5
1.8
1.6
13.8
14.2
0.8
0.7
Mahindra and Mahindra Neutral
1,325
-
82,270
46,534
53,077
11.6
11.7
67.3
78.1
19.7
17.0
3.2
2.8
15.4
15.8
1.7
1.5
Maruti
Accumulate
5,919
6,560
178,795
67,822
83,288
16.0
16.4
253.8
312.4
23.3
19.0
5.4
4.3
23.0
22.9
2.3
1.8
Minda Industries
Neutral
424
-
3,359
2,728
3,042
9.0
9.1
68.2
86.2
6.2
4.9
1.4
1.1
23.8
24.3
1.3
1.1
Motherson Sumi
Neutral
353
-
49,477
45,896
53,687
7.8
8.3
13.0
16.1
27.0
21.9
8.7
7.0
34.7
35.4
1.2
1.0
Rane Brake Lining
Neutral
957
-
757
511
562
11.3
11.5
28.1
30.9
34.1
31.0
5.2
4.7
15.3
15.0
1.6
1.5
Setco Automotive
Neutral
35
-
472
741
837
13.0
13.0
15.2
17.0
2.3
2.1
0.4
0.4
15.8
16.3
1.0
0.9
Tata Motors
Neutral
461
-
133,121
300,209
338,549
8.9
8.4
42.7
54.3
10.8
8.5
1.7
1.5
15.6
17.2
0.6
0.5
TVS Motor
Neutral
426
-
20,248
13,390
15,948
6.9
7.1
12.8
16.5
33.4
25.8
8.3
6.6
26.3
27.2
1.6
1.3
Amara Raja Batteries
Buy
844
1,009
14,423
5,305
6,100
16.0
16.3
28.4
34.0
29.7
24.8
5.7
4.8
19.3
19.3
2.7
2.4
Exide Industries
Neutral
213
-
18,118
7,439
8,307
15.0
15.0
8.1
9.3
26.3
22.9
3.7
3.3
14.3
16.7
2.1
1.8
Apollo Tyres
Buy
181
235
9,224
12,877
14,504
14.3
13.9
21.4
23.0
8.5
7.9
1.3
1.1
16.4
15.2
0.9
0.8
Ceat
Buy
1,153
1,450
4,664
7,524
8,624
13.0
12.7
131.1
144.3
8.8
8.0
1.6
1.4
19.8
18.6
0.7
0.6
JK Tyres
Neutral
121
-
2,744
7,455
8,056
15.0
15.0
21.8
24.5
5.6
4.9
1.2
0.9
22.8
21.3
0.5
0.4
Swaraj Engines
Neutral
1,396
-
1,734
660
810
15.2
16.4
54.5
72.8
25.6
19.2
8.0
7.2
31.5
39.2
2.4
2.0
Subros
Neutral
200
-
1,198
1,488
1,681
11.7
11.9
6.4
7.2
31.2
27.9
3.3
3.0
10.8
11.4
1.0
0.9
Indag Rubber
Neutral
199
-
522
286
326
19.8
16.8
11.7
13.3
17.0
14.9
2.9
2.7
17.8
17.1
1.5
1.3
Capital Goods
ACE
Neutral
53
-
526
709
814
4.1
4.6
1.4
2.1
38.0
25.3
1.6
1.5
4.4
6.0
0.9
0.8
BEML
Neutral
1,297
-
5,400
3,451
4,055
6.3
9.2
31.4
57.9
41.3
22.4
2.5
2.3
6.3
10.9
1.7
1.4
Bharat Electronics
Neutral
1,503
-
33,580
8,137
9,169
16.8
17.2
58.7
62.5
25.6
24.1
4.0
3.5
44.6
46.3
3.1
2.8
Stock Watch
March 03, 2017
Company Name
Reco
CMP
Target
Mkt Cap
Sales ( Čcr )
OPM(%)
EPS (Č)
PER(x)
P/BV(x)
RoE(%)
EV/Sales(x)
(Č)
Price ( Č)
( Č cr )
FY17E
FY18E
FY17E
FY18E
FY17E
FY18E
FY17E
FY18E
FY17E
FY18E
FY17E
FY18E
FY17E
FY18E
Capital Goods
Voltas
Accumulate
370
407
12,256
6,511
7,514
7.9
8.7
12.9
16.3
28.7
22.7
5.2
4.5
16.7
18.5
1.6
1.4
BGR Energy
Neutral
132
-
954
16,567
33,848
6.0
5.6
7.8
5.9
17.0
22.4
1.0
0.9
4.7
4.2
0.2
0.1
BHEL
Neutral
158
-
38,746
28,797
34,742
-
2.8
2.3
6.9
68.8
22.9
1.2
1.1
1.3
4.8
1.0
0.7
Blue Star
Accumulate
566
634
5,410
4,283
5,077
5.9
7.3
14.9
22.1
38.0
25.6
7.4
6.2
20.4
26.4
1.3
1.1
Crompton Greaves
Neutral
67
-
4,227
5,777
6,120
5.9
7.0
3.3
4.5
20.4
15.0
0.9
0.9
4.4
5.9
0.7
0.6
Greaves Cotton
Neutral
158
-
3,862
1,755
1,881
16.8
16.9
7.8
8.5
20.3
18.6
4.1
3.8
20.6
20.9
1.9
1.7
Inox Wind
Neutral
166
-
3,691
5,605
6,267
15.7
16.4
24.8
30.0
6.7
5.5
1.9
1.4
25.9
24.4
0.7
0.6
KEC International
Neutral
163
-
4,196
9,294
10,186
7.9
8.1
9.9
11.9
16.5
13.7
2.4
2.1
15.6
16.3
0.7
0.6
KEI Industries
Buy
173
207
1,348
2,682
3,058
10.4
10.0
11.7
12.8
14.8
13.5
3.0
2.5
20.1
18.2
0.7
0.6
Thermax
Neutral
876
-
10,434
5,421
5,940
7.3
7.3
25.7
30.2
34.1
29.0
4.1
3.8
12.2
13.1
1.8
1.7
VATech Wabag
Buy
570
681
3,107
3,136
3,845
8.9
9.1
26.0
35.9
21.9
15.9
2.7
2.3
13.4
15.9
0.9
0.7
Cement
ACC
Neutral
1,408
-
26,433
11,225
13,172
13.2
16.9
44.5
75.5
31.6
18.6
3.0
2.8
11.2
14.2
2.4
2.0
Ambuja Cements
Neutral
229
-
45,382
9,350
10,979
18.2
22.5
5.8
9.5
39.4
24.1
3.3
3.0
10.2
12.5
4.9
4.1
India Cements
Neutral
162
-
4,966
4,364
4,997
18.5
19.2
7.9
11.3
20.5
14.3
1.5
1.4
8.0
8.5
1.9
1.7
JK Cement
Neutral
868
-
6,070
4,398
5,173
15.5
17.5
31.2
55.5
27.8
15.6
3.3
2.9
12.0
15.5
1.9
1.6
J K Lakshmi Cement
Neutral
407
-
4,790
2,913
3,412
14.5
19.5
7.5
22.5
54.3
18.1
3.3
2.8
12.5
18.0
2.2
1.9
Orient Cement
Neutral
144
-
2,951
2,114
2,558
18.5
20.5
8.1
11.3
17.8
12.8
2.6
2.2
9.0
14.0
2.0
1.6
UltraTech Cement
Neutral
3,804
-
104,421
25,768
30,385
21.0
23.5
111.0
160.0
34.3
23.8
4.4
3.8
13.5
15.8
4.2
3.5
Construction
ITNL
Neutral
101
-
3,318
8,946
10,017
31.0
31.6
8.1
9.1
12.5
11.1
0.5
0.5
4.2
5.0
3.7
3.4
KNR Constructions
Neutral
179
-
2,521
1,385
1,673
14.7
14.0
41.2
48.5
4.4
3.7
0.8
0.7
14.9
15.2
1.9
1.6
Larsen & Toubro
Accumulate
1,475
1,634
137,612
111,017
124,908
11.0
11.0
61.1
66.7
24.1
22.1
2.9
2.7
13.1
12.9
2.3
2.1
Gujarat Pipavav Port
Neutral
155
-
7,481
705
788
52.2
51.7
5.0
5.6
31.0
27.6
3.1
2.7
11.2
11.2
10.3
8.7
Nagarjuna Const.
Neutral
81
-
4,503
8,842
9,775
9.1
8.8
5.3
6.4
15.3
12.7
1.2
1.1
8.2
9.1
0.7
0.6
PNC Infratech
Buy
101
143
2,581
2,350
2,904
13.1
13.2
9.0
8.8
11.2
11.4
0.4
0.4
15.9
13.9
1.2
1.0
Simplex Infra
Neutral
300
-
1,484
6,829
7,954
10.5
10.5
31.4
37.4
9.6
8.0
1.0
0.9
9.9
13.4
0.6
0.5
Power Mech Projects
Neutral
429
-
631
1,801
2,219
12.7
14.6
72.1
113.9
6.0
3.8
1.1
0.9
16.8
11.9
0.4
0.3
Sadbhav Engineering
Accumulate
272
298
4,668
3,598
4,140
10.3
10.6
9.0
11.9
30.2
22.9
3.2
2.8
9.9
11.9
1.6
1.3
NBCC
Neutral
166
-
14,931
7,428
9,549
7.9
8.6
8.2
11.0
20.2
15.1
1.0
0.8
28.2
28.7
1.7
1.3
MEP Infra
Neutral
44
-
723
1,877
1,943
30.6
29.8
3.0
4.2
14.8
10.6
7.2
4.8
0.6
0.6
1.8
1.6
Stock Watch
March 03, 2017
Company Name
Reco
CMP
Target
Mkt Cap
Sales ( Čcr )
OPM(%)
EPS (Č)
PER(x)
P/BV(x)
RoE(%)
EV/Sales(x)
(Č)
Price ( Č)
( Č cr )
FY17E
FY18E
FY17E
FY18E
FY17E
FY18E
FY17E
FY18E
FY17E
FY18E
FY17E
FY18E
FY17E
FY18E
Construction
SIPL
Neutral
95
-
3,357
1,036
1,252
65.5
66.2
(8.4)
(5.6)
3.6
4.1
(22.8)
(15.9)
11.5
9.5
Engineers India
Neutral
148
-
9,943
1,725
1,935
16.0
19.1
11.4
13.9
12.9
10.6
1.8
1.7
13.4
15.3
4.7
4.2
Financials
Axis Bank
Accumulate
506
580
121,116
46,932
53,575
3.5
3.4
32.4
44.6
15.7
11.3
2.0
1.8
13.6
16.5
-
-
Bank of Baroda
Neutral
162
-
37,235
19,980
23,178
1.8
1.8
11.5
17.3
14.1
9.3
1.6
1.3
8.3
10.1
-
-
Canara Bank
Neutral
291
-
15,777
15,225
16,836
1.8
1.8
14.5
28.0
20.0
10.4
1.4
1.1
5.8
8.5
-
-
Can Fin Homes
Accumulate
1,965
2,128
5,231
420
526
3.5
3.5
86.5
107.8
22.7
18.2
4.9
4.0
23.6
24.1
-
-
Cholamandalam Inv. &
Buy
952
1,230
14,870
2,012
2,317
6.3
6.3
42.7
53.6
22.3
17.8
3.5
3.0
16.9
18.3
-
-
Fin. Co.
Dewan Housing Finance Accumulate
325
350
10,162
2,225
2,688
2.9
2.9
29.7
34.6
10.9
9.4
1.8
1.5
16.1
16.8
-
-
Equitas Holdings
Buy
174
235
5,861
939
1,281
11.7
11.5
5.8
8.2
30.0
21.2
2.6
2.3
10.9
11.5
-
-
Federal Bank
Neutral
85
-
14,615
8,259
8,995
3.0
3.0
4.3
5.6
19.7
15.2
1.7
1.5
8.5
10.1
-
-
HDFC
Neutral
1,398
-
221,681
11,475
13,450
3.4
3.4
45.3
52.5
30.9
26.6
6.0
5.3
20.2
20.5
-
-
HDFC Bank
Neutral
1,380
-
353,175
46,097
55,433
4.5
4.5
58.4
68.0
23.6
20.3
4.1
3.5
18.8
18.6
-
-
ICICI Bank
Accumulate
278
315
162,015
42,800
44,686
3.1
3.3
18.0
21.9
15.5
12.7
2.1
1.9
11.1
12.3
-
-
Lakshmi Vilas Bank
Accumulate
161
174
3,086
3,339
3,799
2.7
2.8
11.0
14.0
14.7
11.5
1.5
1.4
11.2
12.7
-
-
LIC Housing Finance
Accumulate
553
630
27,900
3,712
4,293
2.6
2.5
39.0
46.0
14.2
12.0
2.7
2.3
19.9
20.1
-
-
Punjab Natl.Bank
Neutral
139
-
29,621
23,532
23,595
2.3
2.4
6.8
12.6
20.5
11.1
3.2
2.3
3.3
6.5
-
-
RBL Bank
Neutral
463
-
17,104
1,783
2,309
2.6
2.6
12.7
16.4
36.4
28.2
4.0
3.6
12.8
13.3
-
-
South Ind.Bank
Neutral
20
-
2,752
6,435
7,578
2.5
2.5
2.7
3.1
7.5
6.6
1.0
0.8
10.1
11.2
-
-
St Bk of India
Neutral
267
-
212,893
88,650
98,335
2.6
2.6
13.5
18.8
19.8
14.2
1.9
1.7
7.0
8.5
-
-
Union Bank
Neutral
146
-
10,026
13,450
14,925
2.3
2.3
25.5
34.5
5.7
4.2
0.8
0.7
7.5
10.2
-
-
Yes Bank
Neutral
1,426
-
60,388
8,978
11,281
3.3
3.4
74.0
90.0
19.3
15.9
3.7
3.1
17.0
17.2
-
-
FMCG
Asian Paints
Neutral
1,028
-
98,634
17,128
18,978
16.8
16.4
19.1
20.7
53.8
49.7
18.7
17.7
34.8
35.5
5.7
5.1
Britannia
Buy
3,110
3,626
37,324
9,594
11,011
14.6
14.9
80.3
94.0
38.7
33.1
15.9
12.3
41.2
-
3.8
3.2
Colgate
Accumulate
891
995
24,239
4,605
5,149
23.4
23.4
23.8
26.9
37.5
33.1
20.7
16.2
64.8
66.8
5.2
4.6
Dabur India
Accumulate
276
304
48,618
8,315
9,405
19.8
20.7
8.1
9.2
34.1
30.0
9.5
7.9
31.6
31.0
5.5
4.8
GlaxoSmith Con*
Neutral
5,115
-
21,511
4,350
4,823
21.2
21.4
179.2
196.5
28.5
26.0
7.6
6.4
27.1
26.8
4.3
3.8
Godrej Consumer
Neutral
1,607
-
54,728
10,235
11,428
18.4
18.6
41.1
44.2
39.1
36.4
8.7
7.3
24.9
24.8
5.4
4.8
HUL
Neutral
878
-
189,926
35,252
38,495
17.8
17.8
20.7
22.4
42.5
39.2
40.6
34.8
95.6
88.9
5.2
4.8
ITC
Accumulate
265
284
320,910
40,059
44,439
38.3
39.2
9.0
10.1
29.5
26.1
8.2
7.2
27.8
27.5
7.5
6.8
Stock Watch
March 03, 2017
Company Name
Reco
CMP
Target
Mkt Cap
Sales ( Čcr )
OPM(%)
EPS (Č)
PER(x)
P/BV(x)
RoE(%)
EV/Sales(x)
(Č)
Price ( Č)
( Č cr )
FY17E FY18E
FY17E
FY18E
FY17E
FY18E
FY17E
FY18E
FY17E
FY18E
FY17E
FY18E
FY17E
FY18E
FMCG
Marico
Accumulate
282
300
36,356
6,430
7,349
18.8
19.5
6.4
7.7
44.0
36.6
13.3
11.2
33.2
32.5
5.5
4.7
Nestle*
Neutral
6,182
-
59,602
10,073
11,807
20.7
21.5
124.8
154.2
49.5
40.1
20.3
18.3
34.8
36.7
5.7
4.9
Tata Global
Neutral
141
-
8,905
8,675
9,088
9.8
9.8
7.4
8.2
19.1
17.2
2.2
2.1
7.9
8.1
0.9
0.9
Procter & Gamble
Neutral
7,074
-
22,961
2,939
3,342
23.2
23.0
146.2
163.7
48.4
43.2
108.3
103.9
25.3
23.5
7.4
6.4
Hygiene
IT
HCL Tech^
Buy
842
1,000
118,886
49,242
57,168
20.5
20.5
55.7
64.1
15.1
13.1
3.1
2.4
20.3
17.9
2.3
1.8
Infosys
Buy
1,021
1,249
234,438
68,350
77,326
27.0
27.0
62.5
69.4
16.3
14.7
3.5
3.2
21.3
21.6
2.9
2.5
TCS
Accumulate
2,501
2,700
492,834
119,025
133,308
27.6
27.6
131.2
145.5
19.1
17.2
6.2
5.7
32.4
33.1
3.9
3.5
Tech Mahindra
Buy
498
600
48,511
29,673
32,937
15.5
17.0
32.8
39.9
15.2
12.5
3.0
2.6
19.6
20.7
1.4
1.2
Wipro
Buy
489
583
118,931
55,440
60,430
18.1
18.1
36.1
38.9
13.6
12.6
2.4
2.2
19.0
17.6
1.9
1.6
Media
D B Corp
Neutral
371
-
6,830
2,297
2,590
27.4
28.2
21.0
23.4
17.7
15.9
4.1
3.6
23.7
23.1
2.8
2.4
HT Media
Neutral
83
-
1,935
2,693
2,991
12.6
12.9
7.9
9.0
10.5
9.2
0.9
0.8
7.8
8.3
0.3
0.2
Jagran Prakashan
Buy
189
225
6,166
2,355
2,635
28.0
28.0
10.8
12.5
17.5
15.1
3.8
3.3
21.7
21.7
2.6
2.3
Sun TV Network
Neutral
707
-
27,842
2,850
3,265
70.1
71.0
26.2
30.4
27.0
23.2
6.9
6.1
24.3
25.6
9.4
8.0
Hindustan Media
Neutral
268
-
1,970
1,016
1,138
24.3
25.2
27.3
30.1
9.8
8.9
1.9
1.7
16.2
15.8
1.3
1.1
Ventures
TV Today Network
Buy
260
385
1,552
637
743
27.5
27.5
18.4
21.4
14.2
12.2
2.5
2.1
17.4
17.2
2.0
1.7
Metals & Mining
Coal India
Neutral
322
-
199,630
84,638
94,297
21.4
22.3
24.5
27.1
13.1
11.9
5.5
5.2
42.6
46.0
1.9
1.7
Hind. Zinc
Neutral
310
-
131,027
14,252
18,465
55.9
48.3
15.8
21.5
19.6
14.4
3.2
2.8
17.0
20.7
9.2
7.1
Hindalco
Neutral
190
-
39,158
107,899
112,095
7.4
8.2
9.2
13.0
20.6
14.6
1.0
0.9
4.8
6.6
0.9
0.8
JSW Steel
Neutral
183
-
44,320
53,201
58,779
16.1
16.2
130.6
153.7
1.4
1.2
0.2
0.2
14.0
14.4
1.6
1.4
NMDC
Neutral
145
-
45,940
6,643
7,284
44.4
47.7
7.1
7.7
20.5
18.9
1.8
1.7
8.8
9.2
4.7
4.2
SAIL
Neutral
62
-
25,545
47,528
53,738
(0.7)
2.1
(1.9)
2.6
23.8
0.7
0.6
(1.6)
3.9
1.4
1.3
Vedanta
Neutral
271
-
80,314
71,744
81,944
19.2
21.7
13.4
20.1
20.2
13.5
1.7
1.6
8.4
11.3
1.5
1.2
Tata Steel
Neutral
495
-
48,080
121,374
121,856
7.2
8.4
18.6
34.3
26.6
14.4
1.7
1.5
6.1
10.1
1.0
1.0
Oil & Gas
Cairn India
Neutral
295
-
55,301
9,127
10,632
4.3
20.6
8.8
11.7
33.5
25.2
1.1
1.1
3.3
4.2
7.5
6.3
GAIL
Neutral
503
-
63,792
56,220
65,198
9.3
10.1
27.1
33.3
18.6
15.1
1.7
1.6
9.3
10.7
1.3
1.1
ONGC
Neutral
193
-
247,232
137,222
152,563
15.0
21.8
19.5
24.1
9.9
8.0
0.8
0.8
8.5
10.1
2.1
1.9
Indian Oil Corp
Neutral
377
-
182,922
373,359
428,656
5.9
5.5
54.0
59.3
7.0
6.4
1.1
1.0
16.0
15.6
0.6
0.6
Reliance Industries
Neutral
1,233
-
400,049
301,963
358,039
12.1
12.6
87.7
101.7
14.1
12.1
1.4
1.3
10.7
11.3
1.8
1.5
Pharmaceuticals
Alembic Pharma
Neutral
597
-
11,250
3,483
4,083
20.2
21.4
24.3
30.4
24.6
19.6
5.6
4.5
25.5
25.3
3.2
2.6
Stock Watch
March 03, 2017
Company Name
Reco
CMP
Target
Mkt Cap
Sales ( Čcr )
OPM(%)
EPS (Č)
PER(x)
P/BV(x)
RoE(%)
EV/Sales(x)
(Č)
Price ( Č)
( Č cr )
FY17E
FY18E
FY17E
FY18E
FY17E
FY18E
FY17E
FY18E
FY17E
FY18E
FY17E
FY18E
FY17E
FY18E
Pharmaceuticals
Alkem Laboratories Ltd
Neutral
2,142
-
25,612
6,065
7,009
18.7
20.0
80.2
92.0
26.7
23.3
6.0
5.0
22.5
21.6
4.2
3.6
Aurobindo Pharma
Buy
668
877
39,081
15,720
18,078
23.7
23.7
41.4
47.3
16.1
14.1
4.2
3.3
29.6
26.1
2.7
2.3
Aventis*
Neutral
4,261
-
9,813
2,277
2,597
17.3
18.3
149.4
172.0
28.5
24.8
4.7
3.8
25.1
28.8
4.0
3.2
Cadila Healthcare
Neutral
431
-
44,118
10,429
12,318
17.7
21.6
13.1
19.2
32.9
22.5
6.9
5.5
22.8
27.1
4.3
3.5
Cipla
Sell
587
465
47,231
15,378
18,089
15.7
16.8
19.3
24.5
30.4
24.0
3.6
3.1
12.3
13.9
3.2
2.7
Dr Reddy's
Neutral
2,869
-
47,531
16,043
18,119
18.0
23.0
78.6
130.9
36.5
21.9
3.6
3.1
10.1
15.2
2.7
2.6
Dishman Pharma
Neutral
223
-
3,605
1,718
1,890
22.7
22.8
9.5
11.3
23.5
19.8
2.3
2.1
10.1
10.9
2.6
2.2
GSK Pharma*
Neutral
2,689
-
22,775
2,800
3,290
10.2
20.6
32.2
60.3
83.5
44.6
15.5
15.3
17.2
34.5
7.9
6.8
Indoco Remedies
Reduce
268
240
2,470
1,112
1,289
16.2
18.2
11.6
16.0
23.1
16.8
3.7
3.1
17.0
20.1
2.3
2.0
Ipca labs
Accumulate
543
613
6,854
3,258
3,747
12.8
15.3
12.1
19.2
44.9
28.3
2.8
2.6
6.4
9.5
2.2
1.9
Lupin
Buy
1,461
1,809
65,969
15,912
18,644
26.4
26.7
58.1
69.3
25.2
21.1
4.9
4.0
21.4
20.9
4.2
3.5
Sun Pharma
Buy
676
847
162,199
31,129
35,258
32.0
32.9
30.2
35.3
22.4
19.2
3.7
3.0
20.0
20.1
4.8
4.0
Power
Tata Power
Neutral
81
-
21,922
36,916
39,557
17.4
27.1
5.1
6.3
15.9
12.9
1.4
1.3
9.0
10.3
1.6
1.4
NTPC
Neutral
156
-
128,670
86,605
95,545
17.5
20.8
11.8
13.4
13.2
11.7
1.3
1.3
10.5
11.1
2.8
2.8
Power Grid
Buy
190
223
99,269
25,315
29,193
88.2
88.7
14.2
17.2
13.4
11.1
2.0
1.8
15.2
16.1
8.6
7.7
Real Estate
Prestige Estate
Buy
173
210
6,482
4,707
5,105
25.2
26.0
10.3
13.0
16.8
13.3
1.4
1.3
10.3
10.2
2.5
2.3
MLIFE
Buy
346
522
1,420
1,152
1,300
22.7
24.6
29.9
35.8
11.6
9.7
0.9
0.8
7.6
8.6
1.9
1.6
Telecom
Bharti Airtel
Neutral
356
-
142,467
105,086
114,808
34.5
34.7
12.2
16.4
29.2
21.7
2.0
1.8
6.8
8.4
2.3
2.0
Idea Cellular
Neutral
110
-
39,457
40,133
43,731
37.2
37.1
6.4
6.5
17.1
16.9
1.4
1.3
8.2
7.6
2.0
1.7
zOthers
Abbott India
Neutral
4,431
-
9,415
3,153
3,583
14.1
14.4
152.2
182.7
29.1
24.3
142.9
122.1
25.6
26.1
2.7
2.3
Asian Granito
Buy
279
351
839
1,060
1,169
12.2
12.5
12.7
15.9
22.0
17.6
2.1
1.9
9.5
10.7
1.1
1.0
Bajaj Electricals
Accumulate
257
295
2,599
4,801
5,351
5.7
6.2
10.4
13.7
24.6
18.8
3.0
2.7
12.4
14.5
0.5
0.5
Banco Products (India)
Neutral
202
-
1,441
1,353
1,471
12.3
12.4
14.5
16.3
13.9
12.4
19.2
17.3
14.5
14.6
1.0
107.8
Coffee Day Enterprises
Neutral
234
-
4,828
2,964
3,260
20.5
21.2
4.7
8.0
-
29.3
2.7
2.5
5.5
8.5
2.0
1.8
Ltd
Competent Automobiles Neutral
169
-
104
1,137
1,256
3.1
2.7
28.0
23.6
6.1
7.2
32.6
29.4
14.3
11.5
0.1
0.1
Elecon Engineering
Neutral
53
-
599
1,482
1,660
13.7
14.5
3.9
5.8
13.7
9.2
3.2
3.0
7.8
10.9
0.7
0.6
Finolex Cables
Neutral
441
-
6,748
2,883
3,115
12.0
12.1
14.2
18.6
31.1
23.7
16.5
14.4
15.8
14.6
2.0
1.8
Garware Wall Ropes
Accumulate
672
710
1,470
863
928
15.1
15.2
36.4
39.4
18.5
17.1
3.3
2.9
17.5
15.9
1.6
1.5
Goodyear India*
Neutral
718
-
1,657
1,598
1,704
10.4
10.2
49.4
52.6
14.5
13.7
67.1
58.9
18.2
17.0
0.7
100.3
Stock Watch
March 03, 2017
Company Name
Reco
CMP
Target
Mkt Cap
Sales ( Čcr )
OPM(%)
EPS (Č)
PER(x)
P/BV(x)
RoE(%)
EV/Sales(x)
(Č)
Price ( Č)
( Č cr )
FY17E
FY18E
FY17E
FY18E
FY17E
FY18E
FY17E
FY18E
FY17E
FY18E
FY17E
FY18E
FY17E
FY18E
zOthers
Hitachi
Neutral
1,452
-
3,947
2,081
2,433
8.8
8.9
33.4
39.9
43.5
36.4
35.1
29.2
22.1
21.4
1.9
1.6
HSIL
Neutral
320
-
2,312
2,384
2,515
15.8
16.3
15.3
19.4
20.9
16.5
20.8
17.9
7.8
9.3
1.1
1.0
Interglobe Aviation
Neutral
864
-
31,240
21,122
26,005
14.5
27.6
110.7
132.1
7.8
6.5
46.7
33.4
168.5
201.1
1.5
1.1
Jyothy Laboratories
Neutral
366
-
6,653
1,440
2,052
11.5
13.0
8.5
10.0
43.1
36.6
10.4
9.7
18.6
19.3
4.9
3.4
Kirloskar Engines India
Neutral
361
-
5,218
2,554
2,800
9.9
10.0
10.5
12.1
34.4
29.8
14.4
13.6
10.7
11.7
1.7
1.5
Ltd
Linc Pen & Plastics
Neutral
250
-
370
382
420
9.3
9.5
13.5
15.7
18.6
15.9
3.2
2.8
17.1
17.3
1.0
0.9
M M Forgings
Neutral
465
-
561
546
608
20.4
20.7
41.3
48.7
11.3
9.5
63.7
56.4
16.6
17.0
0.9
0.8
Manpasand Bever.
Neutral
739
-
4,231
836
1,087
19.6
19.4
16.9
23.8
43.8
31.1
5.3
4.6
12.0
14.8
4.8
3.6
Mirza International
Buy
90
107
1,083
1,024
1,148
18.0
18.0
6.9
8.0
13.1
11.2
2.2
1.9
16.6
16.3
1.3
1.1
MT Educare
Neutral
95
-
379
366
417
17.7
18.2
9.4
10.8
10.2
8.8
2.3
2.0
22.2
22.3
0.9
0.8
Narayana Hrudaya
Neutral
326
-
6,653
1,873
2,166
11.5
11.7
2.6
4.0
123.1
82.1
7.6
6.8
6.1
8.3
3.7
3.1
Navkar Corporation
Buy
164
265
2,332
369
561
42.9
42.3
7.2
11.5
22.6
14.2
1.7
1.5
7.4
10.5
7.3
4.8
Navneet Education
Neutral
148
-
3,454
1,062
1,147
24.0
24.0
6.1
6.6
24.3
22.3
5.0
4.4
20.6
19.8
3.3
3.1
Nilkamal
Neutral
1,942
-
2,898
1,995
2,165
10.7
10.4
69.8
80.6
27.8
24.1
111.0
96.4
16.6
16.5
1.4
1.3
Page Industries
Neutral
14,318
-
15,970
2,450
3,124
20.1
17.6
299.0
310.0
47.9
46.2
318.9
243.4
47.1
87.5
6.6
5.2
Parag Milk Foods
Neutral
223
-
1,872
1,919
2,231
9.3
9.6
9.5
12.9
23.6
17.2
3.7
3.0
15.5
17.5
1.1
1.0
Quick Heal
Neutral
245
-
1,720
408
495
27.3
27.0
7.7
8.8
31.7
27.9
2.9
3.0
9.3
10.6
3.4
2.8
Radico Khaitan
Buy
128
147
1,699
1,667
1,824
13.0
13.2
6.7
8.2
19.2
15.6
1.7
1.6
9.0
10.2
1.4
1.3
Relaxo Footwears
Neutral
439
-
5,271
2,085
2,469
9.2
8.2
7.6
8.0
58.1
55.2
22.5
19.2
17.9
18.8
2.6
2.2
S H Kelkar & Co.
Neutral
291
-
4,213
1,036
1,160
15.1
15.0
6.1
7.2
47.7
40.6
5.1
4.7
10.7
11.5
3.9
3.5
Siyaram Silk Mills
Neutral
1,672
-
1,567
1,652
1,857
11.6
11.7
92.4
110.1
18.1
15.2
2.7
2.3
14.7
15.2
1.2
1.0
Styrolution ABS India*
Neutral
608
-
1,070
1,440
1,537
9.2
9.0
40.6
42.6
15.0
14.3
38.3
34.8
12.3
11.6
0.7
0.6
Surya Roshni
Neutral
193
-
846
3,342
3,625
7.8
7.5
17.3
19.8
11.2
9.8
21.2
17.0
10.5
10.8
0.5
0.5
Team Lease Serv.
Neutral
870
-
1,487
3,229
4,001
1.5
1.8
22.8
32.8
38.2
26.5
4.1
3.6
10.7
13.4
0.4
0.3
The Byke Hospitality
Neutral
166
-
667
287
384
20.5
20.5
7.6
10.7
21.9
15.6
4.6
3.7
20.7
23.5
2.3
1.7
Transport Corporation of
Neutral
204
-
1,565
2,671
2,911
8.5
8.8
13.9
15.7
14.8
13.1
2.0
1.8
13.7
13.8
0.7
0.6
India
TVS Srichakra
Neutral
3,004
-
2,300
2,304
2,614
13.7
13.8
231.1
266.6
13.0
11.3
337.5
265.8
33.9
29.3
1.0
0.9
UFO Moviez
Neutral
402
-
1,110
619
685
33.2
33.4
30.0
34.9
13.4
11.5
1.9
1.6
13.8
13.9
1.5
1.2
Visaka Industries
Neutral
234
-
372
1,051
1,138
10.3
10.4
21.0
23.1
11.2
10.1
30.0
28.1
9.0
9.2
0.6
0.6
Stock Watch
March 03, 2017
Company Name
Reco
CMP
Target Mkt Cap
Sales ( Čcr )
OPM(%)
EPS (Č)
PER(x)
P/BV(x)
RoE(%)
EV/Sales(x)
(Č)
Price ( Č)
( Č cr )
FY17E FY18E FY17E FY18E FY17E FY18E FY17E FY18E FY17E FY18E FY17E FY18E FY17E FY18E
zOthers
VRL Logistics
Neutral
291
-
2,652
1,902
2,119
16.7
16.6
14.6
16.8
20.0
17.3
4.4
3.8
21.9
22.2
1.5
1.3
Wonderla Holidays
Neutral
376
-
2,126
287
355
38.0
40.0
11.3
14.2
33.3
26.5
4.8
4.2
21.4
23.9
7.1
5.8
Source: Company, Angel Research; Note: *December year end; #September year end; &October year end; Price as on March 02, 2017
Market Outlook
March 03, 2017
Research Team Tel: 022 - 39357800
DISCLAIMER
Angel Broking Private Limited (hereinafter referred to as “Angel”) is a registered Member of National Stock Exchange of India
Limited,Bombay Stock Exchange Limited and Metropolitan Stock Exchange Limited. It is also registered as a Depository Participant with
CDSL and Portfolio Manager with SEBI. It also has registration with AMFI as a Mutual Fund Distributor. Angel Broking Private Limited is a
registered entity with SEBI for Research Analyst in terms of SEBI (Research Analyst) Regulations, 2014 vide registration number
INH000000164. Angel or its associates has not been debarred/ suspended by SEBI or any other regulatory authority for accessing
/dealing in securities Market. Angel or its associates/analyst has not received any compensation / managed or
co-managed public offering of securities of the company covered by Analyst during the past twelve months.
This document is solely for the personal information of the recipient, and must not be singularly used as the basis of any investment
decision. Nothing in this document should be construed as investment or financial advice. Each recipient of this document should make
such investigations as they deem necessary to arrive at an independent evaluation of an investment in the securities of the companies
referred to in this document (including the merits and risks involved), and should consult their own advisors to determine the merits and
risks of such an investment.
Reports based on technical and derivative analysis center on studying charts of a stock's price movement, outstanding positions and
trading volume, as opposed to focusing on a company's fundamentals and, as such, may not match with a report on a company's
fundamentals. Investors are advised to refer the Fundamental and Technical Research Reports available on our website to evaluate the
contrary view, if any.
The information in this document has been printed on the basis of publicly available information, internal data and other reliable
sources believed to be true, but we do not represent that it is accurate or complete and it should not be relied on as such, as this
document is for general guidance only. Angel Broking Pvt. Limited or any of its affiliates/ group companies shall not be in any way
responsible for any loss or damage that may arise to any person from any inadvertent error in the information contained in this report.
Angel Broking Pvt. Limited has not independently verified all the information contained within this document. Accordingly, we cannot
testify, nor make any representation or warranty, express or implied, to the accuracy, contents or data contained within this document.
While Angel Broking Pvt. Limited endeavors to update on a reasonable basis the information discussed in this material, there may be
regulatory, compliance, or other reasons that prevent us from doing so.
This document is being supplied to you solely for your information, and its contents, information or data may not be reproduced,
redistributed or passed on, directly or indirectly.
Neither Angel Broking Pvt. Limited, nor its directors, employees or affiliates shall be liable for any loss or damage that may arise from
or in connection with the use of this information.